Kubernetes Introduction
- Introduction
- Networking
- Applications
- YAML manifest for a more complex application
- Step 1: Create the Backend (Redis)
- Step 2: Create the Frontend (Nginx)
- Step 3: Verify Internal Communication
- Step 4: Map the Network Architecture
- Step 5: View the Results
- Step 5: Scale the Frontend
- Step 6: Observe the Load Balancer Endpoints
- Step 7: Verify the Load Balancing
- Debug the application environment
- Important Considerations for
kubectl cp
Introduction
As shown below, there are three workers in this Vanilla Kubernetes 1.30.2 cluster. The first machine 1_ is the cluster master, and the workers are named as n_ where n is 2 to 4.
kubectl get nodes
NAME   STATUS   ROLES           AGE    VERSION
rp1    Ready    control-plane   546d   v1.30.2
rp2    Ready    <none>          546d   v1.30.2
rp3    Ready    <none>          546d   v1.30.2
rp4    Ready    <none>          546d   v1.30.2
Networking
There are four types of networking possibilities in Kubernetes:
- Container to container: handled within the pod of those containers
- Pod to pod: handled by a software-defined network
- Pod to service: handled by kube-proxy and packet filters on the node
- External to service: handled by kueb-proxy and node-based packet filters
The pod is the smallest managed entity in Kubernetes. Within a pod, one or more containers can be started within the same namespace. IP addresses are assigned to Pods. All networks should support direct communication between pods and nodes without network address translation (NAT).
Although a single container pod is standard, there can be multi-container pods that are deployed with:
- sidecar: extends and enhances the functionality of containers such as service mesh
- ambassador: represents data generated by a container
- adapter: adapts a container to a required format
- An init container is a container that prepares something for the main container, which is started from the same Pod
The network is implemented using Kubernetes plugins, such as Flannel.
In Linux, the command ip route show (or simply ip route) displays the system’s Routing Table. This table serves as a lookup table that the operating system uses to determine where to send network packets based on their destination IP address.
| Component | Meaning |
|---|---|
| default | The “catch-all” route. If no other specific route matches, traffic goes here (usually your internet gateway). |
| via | The IP address of the gateway (router) that will handle the traffic. |
| dev | The specific network interface (e.g., eth0, wlan0, ens3) being used. |
| proto kernel | Indicates this route was created automatically by the kernel during configuration. |
| scope link | Means these destination IPs are valid only on this specific network link (your local subnet). |
| src | The local IP address the system will use when sending traffic on this route. |
Kubernetes manages networking across a cluster of machines. We can look at two core components: the CNI (Container Network Interface), which sets up the network connections, and the Overlay Network, which is the “virtual road” traffic actually travels on.
Think of the CNI (Container Network Interface) as a standard “plug” or a set of rules. Kubernetes itself doesn’t actually know how to “do” networking; instead, it provides a specification that says, “If you want to provide networking for my pods, you must follow these steps.”
When a new Pod is scheduled on a node, the kubelet (the node agent) calls the CNI plugin to perform two main tasks:
- Interface Creation: It creates a virtual network interface (like a virtual Ethernet cable) for the pod.
- IP Address Management (IPAM): It assigns a unique IP address to that pod from a pre-defined range.
Because CNI is a standard, you can swap in different networking providers (such as Flannel, Calico, or Cilium) depending on whether you need simple connectivity or advanced security.
I am using Flannel as a CNI plugin.
An Overlay Network is a virtual network built on top of an existing physical network (the “underlay”).
When Pod A on Node 1 wants to talk to Pod B on Node 2:
- Encapsulation: The CNI plugin takes the original packet and wraps it inside a new packet that the physical network understands. This is often done using the VXLAN (Virtual Extensible LAN) protocol 📦.
- Transit: The physical network moves the packet between the nodes using their actual IP addresses.
- Decapsulation: When the packet arrives at Node 2, the CNI plugin “unwraps” the outer envelope and delivers the original packet to the destination Pod.
Why use an Overlay?
- Simplicity: You don’t have to reconfigure your physical routers every time you add a new pod.
- Scale: It allows thousands of pods to have their own unique IPs even if the underlying network is small.
SDN (Software-Defined Networking) is the broader architectural philosophy that enables everything we just discussed.
| Component | Role in SDN | Real-World Kubernetes Equivalent |
| — | — | — |
| Control Plane | The “Manager” | The CNI Controller (e.g., Flannel daemon or Calico’s felix). It watches the K8s API for new pods and decides what IP and routes they need. |
| Data Plane | The “Worker” | The Overlay Network (VXLAN tunnels) or routing tables on each node that actually move the bits. |
💡 Why does this matter?
Without the “Software-Defined” part, every time a developer wanted to launch a new app, a network engineer would have to manually log in to a physical router and update the routing table. In Kubernetes, the SDN (via the CNI) does this automatically in milliseconds.
The lspci -k command is used to see which kernel drivers are currently managing your hardware devices.
In Linux, while the basic lspci command lists the hardware, the -k flag adds crucial “behind-the-scenes” information about the software (drivers) interacting with that hardware.
lspci -k
00:00.0 PCI bridge: Broadcom Inc. and subsidiaries BCM2712 PCIe Bridge (rev 21)
	Kernel driver in use: pcieport
01:00.0 Ethernet controller: Raspberry Pi Ltd RP1 PCIe 2.0 South Bridge
	Kernel driver in use: rp1
Breaking Down Your Output
Looking at your sample, we can see two distinct layers of information:
| Output Line | Meaning |
|---|---|
00:00.0 or 01:00.0 |
The PCI Address (Bus:Device.Function). This is the hardware’s unique “address” on your motherboard. |
Ethernet controller... |
The Hardware Name. This identifies the physical chip. |
Kernel driver in use |
The Active Driver. This is the specific piece of kernel software currently talking to and controlling that device. |
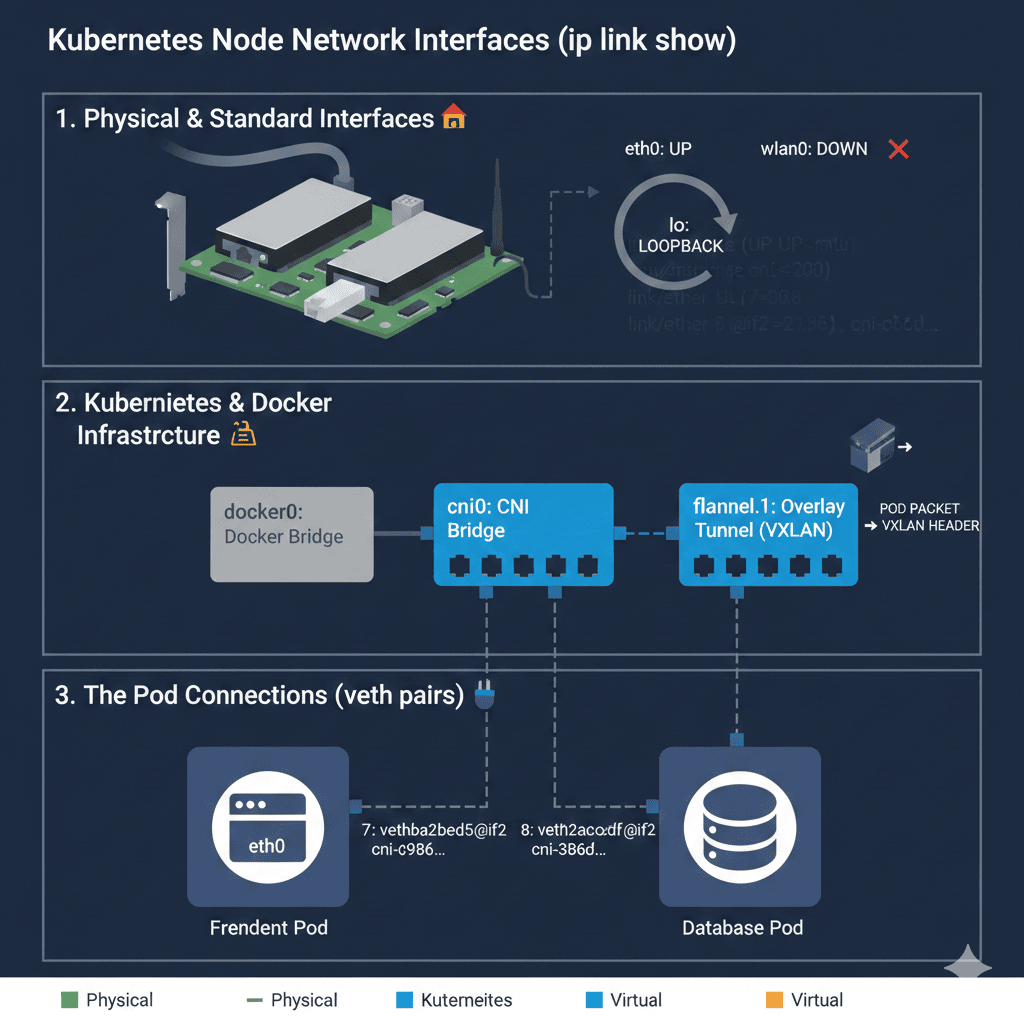
The ip link show command displays the status of all network interfaces (both physical and virtual) currently recognised by the Linux kernel. If lspci -k shows us the “hardware and drivers,” ip link shows us the actual “plugs” and their current state.
ip link show
1: lo: <LOOPBACK,UP,LOWER_UP> mtu 65536 qdisc noqueue state UNKNOWN mode DEFAULT group default qlen 1000
    link/loopback 00:00:00:00:00:00 brd 00:00:00:00:00:00
2: eth0: <BROADCAST,MULTICAST,UP,LOWER_UP> mtu 1500 qdisc pfifo_fast state UP mode DEFAULT group default qlen 1000
    link/ether 2c:cf:67:5a:49:e4 brd ff:ff:ff:ff:ff:ff
3: wlan0: <BROADCAST,MULTICAST> mtu 1500 qdisc noop state DOWN mode DEFAULT group default qlen 1000
    link/ether 2c:cf:67:5a:49:e5 brd ff:ff:ff:ff:ff:ff
4: docker0: <NO-CARRIER,BROADCAST,MULTICAST,UP> mtu 1500 qdisc noqueue state DOWN mode DEFAULT group default
    link/ether 02:42:e3:b9:f4:61 brd ff:ff:ff:ff:ff:ff
5: flannel.1: <BROADCAST,MULTICAST,UP,LOWER_UP> mtu 1450 qdisc noqueue state UNKNOWN mode DEFAULT group default
    link/ether ca:a8:7c:5e:26:fc brd ff:ff:ff:ff:ff:ff
6: cni0: <BROADCAST,MULTICAST,UP,LOWER_UP> mtu 1450 qdisc noqueue state UP mode DEFAULT group default qlen 1000
    link/ether 9e:f8:d5:29:dc:af brd ff:ff:ff:ff:ff:ff
7: vethba2fbed5@if2: <BROADCAST,MULTICAST,UP,LOWER_UP> mtu 1450 qdisc noqueue master cni0 state UP mode DEFAULT group default
    link/ether 06:57:51:35:85:80 brd ff:ff:ff:ff:ff:ff link-netns cni-c986500a-6747-970b-56e3-52f91d353afa
8: veth2cac2cdf@if2: <BROADCAST,MULTICAST,UP,LOWER_UP> mtu 1450 qdisc noqueue master cni0 state UP mode DEFAULT group default
    link/ether 26:a6:6a:c8:e6:72 brd ff:ff:ff:ff:ff:ff link-netns cni-3b6d82d9-527d-2d12-83c0-37abaf22d475
Let’s break down your output into three logical groups to see how they relate to your Kubernetes cluster.
- Physical & Standard Interfaces 🏠
lo(Loopback): A virtual interface used by the computer to talk to itself.eth0: Your primary physical Ethernet connection. It isUP, meaning it’s actively connected to the network.wlan0: Your Wi-Fi interface. It is currentlyDOWN(not connected).
I used a wired connection only for this cluster, with no Wi-Fi.
- Kubernetes & Docker “Infrastructure” 🏗️
This is where your SDN and CNI have been busy building that “virtual highway” we discussed earlier.
docker0: A virtual bridge used by Docker to connect containers.flannel.1: This is your Overlay Network interface (specifically for the Flannel CNI). It acts as a “tunnel” that encapsulates pod traffic so it can travel between different nodes.cni0: A virtual bridge created by the CNI. Think of this as a virtual “power strip” where all the pods on this specific node are plugged in.
- The Pod Connections (veth pairs) 🔌
Interfaces 7 and 8 (
vethba2f...andveth2cac...) are the most interesting for Kubernetes:veth(Virtual Ethernet): These are the individual “patch cables” connecting specific Pods to thecni0bridge.master cni0: This indicates these cables are plugged into thecni0bridge.link-netns: This confirms that the other end of the cable is tucked inside a specific Pod’s private network space.
ip route show
default via 192.168.1.1 dev eth0 proto static
10.244.0.0/24 dev cni0 proto kernel scope link src 10.244.0.1
10.244.1.0/24 via 10.244.1.0 dev flannel.1 onlink
10.244.2.0/24 via 10.244.2.0 dev flannel.1 onlink
10.244.3.0/24 via 10.244.3.0 dev flannel.1 onlink
172.17.0.0/16 dev docker0 proto kernel scope link src 172.17.0.1 linkdown
192.168.1.0/24 dev eth0 proto kernel scope link src 192.168.1.11
Above broadcasting is based on the folloing configuration:
"echo '$SSHPASS' | sudo -S cat /etc/netplan/50-cloud-init.yaml"
[sudo] password for oj: # This file is generated from information provided by the datasource.  Changes
# to it will not persist across an instance reboot.  To disable cloud-init's
# network configuration capabilities, write a file
# /etc/cloud/cloud.cfg.d/99-disable-network-config.cfg with the following:
# network: {config: disabled}
network:
  ethernets:
    eth0:
      dhcp4: no
      dhcp6: no
      optional: false
      addresses:
        - 192.168.1.11/24
      routes:
        - via: 192.168.1.1
          to: default
      nameservers:
          addresses: [192.168.1.1]
  version: 2
  renderer: networkd
And the worker 2 configuration is
"echo '$SSHPASS' | sudo -S cat /etc/netplan/50-cloud-init.yaml"
[sudo] password for oj: # This file is generated from information provided by the datasource.  Changes
# to it will not persist across an instance reboot.  To disable cloud-init's
# network configuration capabilities, write a file
# /etc/cloud/cloud.cfg.d/99-disable-network-config.cfg with the following:
# network: {config: disabled}
network:
  ethernets:
    eth0:
      dhcp4: no
      dhcp6: no
      optional: true
      addresses:
        - 192.168.1.12/24
      routes:
        - via: 192.168.1.1
          to: default
      nameservers:
          addresses: [192.168.1.1]
  version: 2
  renderer: networkd
Since I am using containerd as a runtime (standard for modern Kubernetes clusters), I cannot use the docker ps command. Instead, I use crictl (the Container Runtime Interface CLI) or ctr (the native containerd CLI).
In a Kubernetes environment, crictl is the recommended tool because it is designed to be “Kubernetes-aware.”
"echo '$SSHPASS' | sudo -S crictl ps"
[sudo] password for oj: time="2026-01-03T17:41:15+11:00" level=warning msg="runtime connect using default endpoints: [unix:///run/containerd/containerd.sock unix:///run/crio/crio.sock unix:///var/run/cri-dockerd.sock]. As the default settings are now deprecated, you should set the endpoint instead."
time="2026-01-03T17:41:15+11:00" level=warning msg="image connect using default endpoints: [unix:///run/containerd/containerd.sock unix:///run/crio/crio.sock unix:///var/run/cri-dockerd.sock]. As the default settings are now deprecated, you should set the endpoint instead."
CONTAINER           IMAGE               CREATED             STATE               NAME                      ATTEMPT             POD ID              POD
2b9b48fb5898e       2437cf7621777       3 hours ago         Running             coredns                   5                   614acd6612d21       coredns-7db6d8ff4d-4md4v
f6aeae6fa0512       2437cf7621777       3 hours ago         Running             coredns                   5                   0548191f48e32       coredns-7db6d8ff4d-79shl
a3edfac794de3       01235e17cb305       3 hours ago         Running             kube-flannel              6                   9fb2a08dfc59a       kube-flannel-ds-5k5nx
034eb2029b3df       66dbb96a9149f       3 hours ago         Running             kube-proxy                5                   306ae41485829       kube-proxy-mhk25
89d3db48a666e       84c601f3f72c8       3 hours ago         Running             kube-apiserver            6                   bc9cdba66a7fa       kube-apiserver-rp1
a5347b4388c3e       c7dd04b1bafeb       3 hours ago         Running             kube-scheduler            6                   0c66c8194afa2       kube-scheduler-rp1
7db4d578dcae3       e1dcc3400d3ea       3 hours ago         Running             kube-controller-manager   6                   ee2972849003e       kube-controller-manager-rp1
870bc93f843b4       014faa467e297       3 hours ago         Running             etcd                      6                   f0bcda2de34cf       etcd-rp1
It will show you the Pod ID and the Image clearly. Finding a specific container’s logs via crictl:
"echo '$SSHPASS' | sudo -S crictl logs 2b9b48fb5898e"
[sudo] password for oj: time="2026-01-03T17:45:41+11:00" level=warning msg="runtime connect using default endpoints: [unix:///run/containerd/containerd.sock unix:///run/crio/crio.sock unix:///var/run/cri-dockerd.sock]. As the default settings are now deprecated, you should set the endpoint instead."
.:53
[INFO] plugin/reload: Running configuration SHA512 = 591cf328cccc12bc490481273e738df59329c62c0b729d94e8b61db9961c2fa5f046dd37f1cf888b953814040d180f52594972691cd6ff41be96639138a43908
CoreDNS-1.11.1
linux/arm64, go1.20.7, ae2bbc2
Find the cluster information:
kubectl cluster-info
Kubernetes control plane is running at https://192.168.1.11:6443
CoreDNS is running at https://192.168.1.11:6443/api/v1/namespaces/kube-system/services/kube-dns:dns/proxy

To further debug and diagnose cluster problems, use 'kubectl cluster-info dump'.
You can enable kubectl bash completion: kubectl completion -h | less. For the Linux environment:
source <(kubectl completion bash)
To list all the api resources
kubectl api-resources
NAME                                SHORTNAMES   APIVERSION                          NAMESPACED   KIND
bindings                                         v1                                  true         Binding
componentstatuses                   cs           v1                                  false        ComponentStatus
configmaps                          cm           v1                                  true         ConfigMap
endpoints                           ep           v1                                  true         Endpoints
events                              ev           v1                                  true         Event
limitranges                         limits       v1                                  true         LimitRange
namespaces                          ns           v1                                  false        Namespace
nodes                               no           v1                                  false        Node
persistentvolumeclaims              pvc          v1                                  true         PersistentVolumeClaim
persistentvolumes                   pv           v1                                  false        PersistentVolume
pods                                po           v1                                  true         Pod
podtemplates                                     v1                                  true         PodTemplate
replicationcontrollers              rc           v1                                  true         ReplicationController
resourcequotas                      quota        v1                                  true         ResourceQuota
secrets                                          v1                                  true         Secret
serviceaccounts                     sa           v1                                  true         ServiceAccount
services                            svc          v1                                  true         Service
mutatingwebhookconfigurations                    admissionregistration.k8s.io/v1     false        MutatingWebhookConfiguration
validatingadmissionpolicies                      admissionregistration.k8s.io/v1     false        ValidatingAdmissionPolicy
validatingadmissionpolicybindings                admissionregistration.k8s.io/v1     false        ValidatingAdmissionPolicyBinding
validatingwebhookconfigurations                  admissionregistration.k8s.io/v1     false        ValidatingWebhookConfiguration
customresourcedefinitions           crd,crds     apiextensions.k8s.io/v1             false        CustomResourceDefinition
apiservices                                      apiregistration.k8s.io/v1           false        APIService
controllerrevisions                              apps/v1                             true         ControllerRevision
daemonsets                          ds           apps/v1                             true         DaemonSet
deployments                         deploy       apps/v1                             true         Deployment
replicasets                         rs           apps/v1                             true         ReplicaSet
statefulsets                        sts          apps/v1                             true         StatefulSet
selfsubjectreviews                               authentication.k8s.io/v1            false        SelfSubjectReview
tokenreviews                                     authentication.k8s.io/v1            false        TokenReview
localsubjectaccessreviews                        authorization.k8s.io/v1             true         LocalSubjectAccessReview
selfsubjectaccessreviews                         authorization.k8s.io/v1             false        SelfSubjectAccessReview
selfsubjectrulesreviews                          authorization.k8s.io/v1             false        SelfSubjectRulesReview
subjectaccessreviews                             authorization.k8s.io/v1             false        SubjectAccessReview
horizontalpodautoscalers            hpa          autoscaling/v2                      true         HorizontalPodAutoscaler
cronjobs                            cj           batch/v1                            true         CronJob
jobs                                             batch/v1                            true         Job
certificatesigningrequests          csr          certificates.k8s.io/v1              false        CertificateSigningRequest
ingressclassparameterses                         configuration.konghq.com/v1alpha1   true         IngressClassParameters
kongclusterplugins                  kcp          configuration.konghq.com/v1         false        KongClusterPlugin
kongconsumergroups                  kcg          configuration.konghq.com/v1beta1    true         KongConsumerGroup
kongconsumers                       kc           configuration.konghq.com/v1         true         KongConsumer
kongingresses                       ki           configuration.konghq.com/v1         true         KongIngress
konglicenses                        kl           configuration.konghq.com/v1alpha1   false        KongLicense
kongplugins                         kp           configuration.konghq.com/v1         true         KongPlugin
kongupstreampolicies                kup          configuration.konghq.com/v1beta1    true         KongUpstreamPolicy
kongvaults                          kv           configuration.konghq.com/v1alpha1   false        KongVault
tcpingresses                                     configuration.konghq.com/v1beta1    true         TCPIngress
udpingresses                                     configuration.konghq.com/v1beta1    true         UDPIngress
leases                                           coordination.k8s.io/v1              true         Lease
endpointslices                                   discovery.k8s.io/v1                 true         EndpointSlice
events                              ev           events.k8s.io/v1                    true         Event
flowschemas                                      flowcontrol.apiserver.k8s.io/v1     false        FlowSchema
prioritylevelconfigurations                      flowcontrol.apiserver.k8s.io/v1     false        PriorityLevelConfiguration
ingressclasses                                   networking.k8s.io/v1                false        IngressClass
ingresses                           ing          networking.k8s.io/v1                true         Ingress
networkpolicies                     netpol       networking.k8s.io/v1                true         NetworkPolicy
runtimeclasses                                   node.k8s.io/v1                      false        RuntimeClass
poddisruptionbudgets                pdb          policy/v1                           true         PodDisruptionBudget
clusterrolebindings                              rbac.authorization.k8s.io/v1        false        ClusterRoleBinding
clusterroles                                     rbac.authorization.k8s.io/v1        false        ClusterRole
rolebindings                                     rbac.authorization.k8s.io/v1        true         RoleBinding
roles                                            rbac.authorization.k8s.io/v1        true         Role
priorityclasses                     pc           scheduling.k8s.io/v1                false        PriorityClass
csidrivers                                       storage.k8s.io/v1                   false        CSIDriver
csinodes                                         storage.k8s.io/v1                   false        CSINode
csistoragecapacities                             storage.k8s.io/v1                   true         CSIStorageCapacity
storageclasses                      sc           storage.k8s.io/v1                   false        StorageClass
volumeattachments                                storage.k8s.io/v1                   false        VolumeAttachment
You can use the help using explain:
kubectl explain pod
KIND:       Pod
VERSION:    v1

DESCRIPTION:
    Pod is a collection of containers that can run on a host. This resource is
    created by clients and scheduled onto hosts.

FIELDS:
  apiVersion	<string>
    APIVersion defines the versioned schema of this representation of an object.
    Servers should convert recognized schemas to the latest internal value, and
    may reject unrecognized values. More info:
    https://git.k8s.io/community/contributors/devel/sig-architecture/api-conventions.md#resources

  kind	<string>
    Kind is a string value representing the REST resource this object
    represents. Servers may infer this from the endpoint the client submits
    requests to. Cannot be updated. In CamelCase. More info:
    https://git.k8s.io/community/contributors/devel/sig-architecture/api-conventions.md#types-kinds

  metadata	<ObjectMeta>
    Standard object's metadata. More info:
    https://git.k8s.io/community/contributors/devel/sig-architecture/api-conventions.md#metadata

  spec	<PodSpec>
    Specification of the desired behavior of the pod. More info:
    https://git.k8s.io/community/contributors/devel/sig-architecture/api-conventions.md#spec-and-status

  status	<PodStatus>
    Most recently observed status of the pod. This data may not be up to date.
    Populated by the system. Read-only. More info:
    https://git.k8s.io/community/contributors/devel/sig-architecture/api-conventions.md#spec-and-status
Further, you can get more explanation, for example, about the spec
kubectl explain pod.spec. To find information in recursively:kubectl explain --recursive pod.spec
kubectl get namespaces
NAME                   STATUS   AGE
default                Active   546d
kube-flannel           Active   546d
kube-node-lease        Active   546d
kube-public            Active   546d
kube-system            Active   546d
kubernetes-dashboard   Active   546d
To list the default namespaces
Simple diagnostics for the cluster:
kubectl get componentstatuses
Warning: v1 ComponentStatus is deprecated in v1.19+
NAME                 STATUS    MESSAGE   ERROR
scheduler            Healthy   ok
controller-manager   Healthy   ok
etcd-0               Healthy   ok
For example, to generate more information about rp2
kubectl describe nodes rp2
Name:               rp2
Roles:              <none>
Labels:             beta.kubernetes.io/arch=arm64
                    beta.kubernetes.io/os=linux
                    kubernetes.io/arch=arm64
                    kubernetes.io/hostname=rp2
                    kubernetes.io/os=linux
Annotations:        flannel.alpha.coreos.com/backend-data: {"VNI":1,"VtepMAC":"5e:92:2b:d0:95:57"}
                    flannel.alpha.coreos.com/backend-type: vxlan
                    flannel.alpha.coreos.com/kube-subnet-manager: true
                    flannel.alpha.coreos.com/public-ip: 192.168.1.12
                    kubeadm.alpha.kubernetes.io/cri-socket: unix:///var/run/containerd/containerd.sock
                    node.alpha.kubernetes.io/ttl: 0
                    volumes.kubernetes.io/controller-managed-attach-detach: true
CreationTimestamp:  Tue, 09 Jul 2024 20:59:39 +1000
Taints:             <none>
Unschedulable:      false
Lease:
  HolderIdentity:  rp2
  AcquireTime:     <unset>
  RenewTime:       Sat, 03 Jan 2026 18:16:21 +1100
Conditions:
  Type                 Status  LastHeartbeatTime                 LastTransitionTime                Reason                       Message
  ----                 ------  -----------------                 ------------------                ------                       -------
  NetworkUnavailable   False   Sat, 03 Jan 2026 15:07:52 +1100   Sat, 03 Jan 2026 15:07:52 +1100   FlannelIsUp                  Flannel is running on this node
  MemoryPressure       False   Sat, 03 Jan 2026 18:11:42 +1100   Sat, 03 Jan 2026 15:07:40 +1100   KubeletHasSufficientMemory   kubelet has sufficient memory available
  DiskPressure         False   Sat, 03 Jan 2026 18:11:42 +1100   Sat, 03 Jan 2026 15:07:40 +1100   KubeletHasNoDiskPressure     kubelet has no disk pressure
  PIDPressure          False   Sat, 03 Jan 2026 18:11:42 +1100   Sat, 03 Jan 2026 15:07:40 +1100   KubeletHasSufficientPID      kubelet has sufficient PID available
  Ready                True    Sat, 03 Jan 2026 18:11:42 +1100   Sat, 03 Jan 2026 15:07:40 +1100   KubeletReady                 kubelet is posting ready status
Addresses:
  InternalIP:  192.168.1.12
  Hostname:    rp2
Capacity:
  cpu:                4
  ephemeral-storage:  61008072Ki
  hugepages-1Gi:      0
  hugepages-2Mi:      0
  hugepages-32Mi:     0
  hugepages-64Ki:     0
  memory:             8128200Ki
  pods:               110
Allocatable:
  cpu:                4
  ephemeral-storage:  56225039063
  hugepages-1Gi:      0
  hugepages-2Mi:      0
  hugepages-32Mi:     0
  hugepages-64Ki:     0
  memory:             8025800Ki
  pods:               110
System Info:
  Machine ID:                 ffd13d3d2a3c4c088d71dbbfe300a2c6
  System UUID:                ffd13d3d2a3c4c088d71dbbfe300a2c6
  Boot ID:                    c1e62281-75e8-48e7-8597-5a05aa486ec3
  Kernel Version:             6.8.0-1018-raspi
  OS Image:                   Ubuntu 24.04 LTS
  Operating System:           linux
  Architecture:               arm64
  Container Runtime Version:  containerd://1.7.18
  Kubelet Version:            v1.30.2
  Kube-Proxy Version:         v1.30.2
PodCIDR:                      10.244.1.0/24
PodCIDRs:                     10.244.1.0/24
Non-terminated Pods:          (5 in total)
  Namespace                   Name                                                     CPU Requests  CPU Limits  Memory Requests  Memory Limits  Age
  ---------                   ----                                                     ------------  ----------  ---------------  -------------  ---
  default                     nginx-daemon-7wnmv                                       0 (0%)        0 (0%)      0 (0%)           0 (0%)         539d
  kube-flannel                kube-flannel-ds-c4rfk                                    100m (2%)     0 (0%)      50Mi (0%)        0 (0%)         542d
  kube-system                 kube-proxy-rlggn                                         0 (0%)        0 (0%)      0 (0%)           0 (0%)         542d
  kubernetes-dashboard        kubernetes-dashboard-api-dbf9794fd-66662                 100m (2%)     250m (6%)   200Mi (2%)       400Mi (5%)     542d
  kubernetes-dashboard        kubernetes-dashboard-metrics-scraper-5485b64c47-l26jx    100m (2%)     250m (6%)   200Mi (2%)       400Mi (5%)     542d
Allocated resources:
  (Total limits may be over 100 percent, i.e., overcommitted.)
  Resource           Requests    Limits
  --------           --------    ------
  cpu                300m (7%)   500m (12%)
  memory             450Mi (5%)  800Mi (10%)
  ephemeral-storage  0 (0%)      0 (0%)
  hugepages-1Gi      0 (0%)      0 (0%)
  hugepages-2Mi      0 (0%)      0 (0%)
  hugepages-32Mi     0 (0%)      0 (0%)
  hugepages-64Ki     0 (0%)      0 (0%)
Events:              <none>
In a Kubernetes cluster, kube-proxy is a network agent that runs on every node. Its primary job is to implement the “Service” abstraction, ensuring that traffic sent to a Service’s Virtual IP (ClusterIP) actually reaches the correct Pods.
How kube-proxy Works
When you create a Kubernetes Service, it is assigned a static IP address. However, Pods are ephemeral—they are made and destroyed frequently, and their IP addresses change. kube-proxy bridges this gap.
When you create a Kubernetes Service, it is assigned a static IP address. However, Pods are ephemeral—they are created and destroyed frequently, and their IP addresses change. Kube-proxy bridges this gap.
1. Watching the API Server
kube-proxy constantly monitors the Kubernetes API server for changes to Service and EndpointSlice objects. When a new Service is created or a Pod is added to a Service (via labels), kube-proxy receives an update.
2. Managing Network Rules
Based on those updates, kube-proxy programs the network rules on the local node. It doesn’t actually “proxy” the traffic itself in modern setups; instead, it configures the Linux kernel to do the heavy lifting.
The Three Modes of kube-proxy
kube-proxy can operate in different modes, which determine how it handles traffic:
| Mode | Technology | Performance | Description |
|---|---|---|---|
| IPtables | Linux Netfilter | Standard | The default mode. It creates rules in the node’s iptables to catch traffic to a Service IP and redirect it to a Pod IP using random load balancing. |
| IPVS | IP Virtual Server | High | Designed for massive clusters. It uses hash tables and supports more advanced load-balancing algorithms (like Least Connection). |
| Userspace | Process-level | Low | The oldest mode. Traffic is actually proxied through the kube-proxy process. It is rarely used today due to high overhead. |
Since I am using containerd and likely a standard kubeadm install on my machine (192.168.1.11), I will almost certainly use IPtables mode. If you ever encounter “Connection Refused” when connecting to a service, checking the kube-proxy logs on the remote machine is a key troubleshooting step.
1. Check the Status of kube-proxy Pods
First, verify that the pods are running and see which nodes they are on:
Find about pod redis-db-7c5bd788fd-7vxjv:
kubectl get pod #-A
NAME                            READY   STATUS    RESTARTS      AGE
nginx-daemon-48l6g              1/1     Running   8 (22h ago)   543d
nginx-daemon-7wnmv              1/1     Running   8 (22h ago)   543d
nginx-daemon-g84rj              1/1     Running   8 (22h ago)   543d
redis-db-7c5bd788fd-7vxjv       1/1     Running   4 (22h ago)   4d
web-frontend-5f4cd56f87-t5srs   1/1     Running   4 (22h ago)   4d
web-frontend-5f4cd56f87-vvbd4   1/1     Running   4 (22h ago)   4d
web-frontend-5f4cd56f87-z2drx   1/1     Running   4 (22h ago)   4d
kubectl get pod redis-db-7c5bd788fd-7vxjv -n default
NAME                        READY   STATUS    RESTARTS      AGE
redis-db-7c5bd788fd-7vxjv   1/1     Running   4 (22h ago)   4d
To find out what is going on in this pod:
kubectl get pod redis-db-7c5bd788fd-7vxjv -n default -o yaml
apiVersion: v1
kind: Pod
metadata:
  creationTimestamp: "2026-01-03T10:25:32Z"
  generateName: redis-db-7c5bd788fd-
  labels:
    app: redis-db
    pod-template-hash: 7c5bd788fd
  name: redis-db-7c5bd788fd-7vxjv
  namespace: default
  ownerReferences:
  - apiVersion: apps/v1
    blockOwnerDeletion: true
    controller: true
    kind: ReplicaSet
    name: redis-db-7c5bd788fd
    uid: 515ec193-7c17-4fed-b13e-e9fa4e397942
  resourceVersion: "296818"
  uid: b743d426-6ccb-4c23-b70e-c3743d884165
spec:
  containers:
  - image: redis
    imagePullPolicy: Always
    name: redis
    resources: {}
    terminationMessagePath: /dev/termination-log
    terminationMessagePolicy: File
    volumeMounts:
    - mountPath: /var/run/secrets/kubernetes.io/serviceaccount
      name: kube-api-access-jr4lt
      readOnly: true
  dnsPolicy: ClusterFirst
  enableServiceLinks: true
  nodeName: rp4
  preemptionPolicy: PreemptLowerPriority
  priority: 0
  restartPolicy: Always
  schedulerName: default-scheduler
  securityContext: {}
  serviceAccount: default
  serviceAccountName: default
  terminationGracePeriodSeconds: 30
  tolerations:
  - effect: NoExecute
    key: node.kubernetes.io/not-ready
    operator: Exists
    tolerationSeconds: 300
  - effect: NoExecute
    key: node.kubernetes.io/unreachable
    operator: Exists
    tolerationSeconds: 300
  volumes:
  - name: kube-api-access-jr4lt
    projected:
      defaultMode: 420
      sources:
      - serviceAccountToken:
          expirationSeconds: 3607
          path: token
      - configMap:
          items:
          - key: ca.crt
            path: ca.crt
          name: kube-root-ca.crt
      - downwardAPI:
          items:
          - fieldRef:
              apiVersion: v1
              fieldPath: metadata.namespace
            path: namespace
status:
  conditions:
  - lastProbeTime: null
    lastTransitionTime: "2026-01-07T03:20:26Z"
    status: "True"
    type: PodReadyToStartContainers
  - lastProbeTime: null
    lastTransitionTime: "2026-01-03T10:25:32Z"
    status: "True"
    type: Initialized
  - lastProbeTime: null
    lastTransitionTime: "2026-01-07T03:20:26Z"
    status: "True"
    type: Ready
  - lastProbeTime: null
    lastTransitionTime: "2026-01-07T03:20:26Z"
    status: "True"
    type: ContainersReady
  - lastProbeTime: null
    lastTransitionTime: "2026-01-03T10:25:32Z"
    status: "True"
    type: PodScheduled
  containerStatuses:
  - containerID: containerd://89f6a38b5108cbb8624b56d6a752f3a7bd0439c57574ac49898ad4d42cd1d7a4
    image: docker.io/library/redis:latest
    imageID: docker.io/library/redis@sha256:47200b04138293fae39737e50878a238b13ec0781083126b1b0c63cf5d992e8d
    lastState:
      terminated:
        containerID: containerd://9cdb76f7c07f119a6a47ae1f9b910850b06cf42d42805568271de6ec7e1c6377
        exitCode: 255
        finishedAt: "2026-01-06T12:14:23Z"
        reason: Unknown
        startedAt: "2026-01-06T02:53:42Z"
    name: redis
    ready: true
    restartCount: 4
    started: true
    state:
      running:
        startedAt: "2026-01-07T03:20:26Z"
  hostIP: 192.168.1.14
  hostIPs:
  - ip: 192.168.1.14
  phase: Running
  podIP: 10.244.3.33
  podIPs:
  - ip: 10.244.3.33
  qosClass: BestEffort
  startTime: "2026-01-03T10:25:32Z"
Describe the pod is more readable than the above:
kubectl describe pod redis-db-7c5bd788fd-7vxjv
Name:             redis-db-7c5bd788fd-7vxjv
Namespace:        default
Priority:         0
Service Account:  default
Node:             rp4/192.168.1.14
Start Time:       Sat, 03 Jan 2026 21:25:32 +1100
Labels:           app=redis-db
                  pod-template-hash=7c5bd788fd
Annotations:      <none>
Status:           Running
IP:               10.244.3.33
IPs:
  IP:           10.244.3.33
Controlled By:  ReplicaSet/redis-db-7c5bd788fd
Containers:
  redis:
    Container ID:   containerd://89f6a38b5108cbb8624b56d6a752f3a7bd0439c57574ac49898ad4d42cd1d7a4
    Image:          redis
    Image ID:       docker.io/library/redis@sha256:47200b04138293fae39737e50878a238b13ec0781083126b1b0c63cf5d992e8d
    Port:           <none>
    Host Port:      <none>
    State:          Running
      Started:      Wed, 07 Jan 2026 14:20:26 +1100
    Last State:     Terminated
      Reason:       Unknown
      Exit Code:    255
      Started:      Tue, 06 Jan 2026 13:53:42 +1100
      Finished:     Tue, 06 Jan 2026 23:14:23 +1100
    Ready:          True
    Restart Count:  4
    Environment:    <none>
    Mounts:
      /var/run/secrets/kubernetes.io/serviceaccount from kube-api-access-jr4lt (ro)
Conditions:
  Type                        Status
  PodReadyToStartContainers   True
  Initialized                 True
  Ready                       True
  ContainersReady             True
  PodScheduled                True
Volumes:
  kube-api-access-jr4lt:
    Type:                    Projected (a volume that contains injected data from multiple sources)
    TokenExpirationSeconds:  3607
    ConfigMapName:           kube-root-ca.crt
    ConfigMapOptional:       <nil>
    DownwardAPI:             true
QoS Class:                   BestEffort
Node-Selectors:              <none>
Tolerations:                 node.kubernetes.io/not-ready:NoExecute op=Exists for 300s
                             node.kubernetes.io/unreachable:NoExecute op=Exists for 300s
Events:                      <none>
kubectl get pods -n kube-system -l k8s-app=kube-proxy -o wide
NAME               READY   STATUS    RESTARTS       AGE    IP             NODE   NOMINATED NODE   READINESS GATES
kube-proxy-jtjsl   1/1     Running   5              542d   192.168.1.14   rp4    <none>           <none>
kube-proxy-lznzz   1/1     Running   5              542d   192.168.1.13   rp3    <none>           <none>
kube-proxy-mhk25   1/1     Running   5 (293d ago)   542d   192.168.1.11   rp1    <none>           <none>
kube-proxy-rlggn   1/1     Running   5              542d   192.168.1.12   rp2    <none>           <none>
2. View kube-proxy Logs
If you are experiencing network issues (e.g., services not routing correctly), the logs will indicate whether kube-proxy is failing to sync iptables or IPVS rules.
To see the logs for a specific proxy pod:
# Replace <pod-name> with a name from the command above
kubectl logs -n kube-system kube-proxy-jtjsl
I0103 04:14:59.136893       1 server_linux.go:69] "Using iptables proxy"
I0103 04:14:59.199021       1 server.go:1062] "Successfully retrieved node IP(s)" IPs=["192.168.1.14"]
I0103 04:14:59.200268       1 conntrack.go:119] "Set sysctl" entry="net/netfilter/nf_conntrack_max" value=131072
I0103 04:14:59.200333       1 conntrack.go:59] "Setting nf_conntrack_max" nfConntrackMax=131072
I0103 04:14:59.200453       1 conntrack.go:119] "Set sysctl" entry="net/netfilter/nf_conntrack_tcp_timeout_established" value=86400
I0103 04:14:59.200533       1 conntrack.go:119] "Set sysctl" entry="net/netfilter/nf_conntrack_tcp_timeout_close_wait" value=3600
I0103 04:14:59.276283       1 server.go:659] "kube-proxy running in dual-stack mode" primary ipFamily="IPv4"
I0103 04:14:59.276343       1 server_linux.go:165] "Using iptables Proxier"
I0103 04:14:59.282694       1 server_linux.go:511] "Detect-local-mode set to ClusterCIDR, but no cluster CIDR for family" ipFamily="IPv6"
I0103 04:14:59.282722       1 server_linux.go:528] "Defaulting to no-op detect-local"
I0103 04:14:59.284183       1 proxier.go:243] "Setting route_localnet=1 to allow node-ports on localhost; to change this either disable iptables.localhostNodePorts (--iptables-localhost-nodeports) or set nodePortAddresses (--nodeport-addresses) to filter loopback addresses"
I0103 04:14:59.284554       1 server.go:872] "Version info" version="v1.30.2"
I0103 04:14:59.284583       1 server.go:874] "Golang settings" GOGC="" GOMAXPROCS="" GOTRACEBACK=""
I0103 04:14:59.289578       1 config.go:101] "Starting endpoint slice config controller"
I0103 04:14:59.291489       1 shared_informer.go:313] Waiting for caches to sync for endpoint slice config
I0103 04:14:59.291552       1 config.go:319] "Starting node config controller"
I0103 04:14:59.291545       1 config.go:192] "Starting service config controller"
I0103 04:14:59.291563       1 shared_informer.go:313] Waiting for caches to sync for node config
I0103 04:14:59.291572       1 shared_informer.go:313] Waiting for caches to sync for service config
I0103 04:14:59.392300       1 shared_informer.go:320] Caches are synced for endpoint slice config
I0103 04:14:59.392386       1 shared_informer.go:320] Caches are synced for service config
I0103 04:14:59.392400       1 shared_informer.go:320] Caches are synced for node config
3. Check the “Mode” and Sync Status
You can search the logs to confirm which mode (iptables or IPVS) your cluster is currently using:
"kubectl logs -n kube-system -l k8s-app=kube-proxy"
I0103 03:48:12.275059       1 server.go:874] "Golang settings" GOGC="" GOMAXPROCS="" GOTRACEBACK=""
I0103 03:48:12.282542       1 config.go:101] "Starting endpoint slice config controller"
I0103 03:48:12.282569       1 config.go:319] "Starting node config controller"
I0103 03:48:12.282577       1 shared_informer.go:313] Waiting for caches to sync for endpoint slice config
I0103 03:48:12.282582       1 shared_informer.go:313] Waiting for caches to sync for node config
I0103 03:48:12.282542       1 config.go:192] "Starting service config controller"
I0103 03:48:12.282614       1 shared_informer.go:313] Waiting for caches to sync for service config
I0103 03:48:12.382918       1 shared_informer.go:320] Caches are synced for node config
I0103 03:48:12.382997       1 shared_informer.go:320] Caches are synced for service config
I0103 03:48:12.383008       1 shared_informer.go:320] Caches are synced for endpoint slice config
I0103 04:07:48.632461       1 server.go:874] "Golang settings" GOGC="" GOMAXPROCS="" GOTRACEBACK=""
I0103 04:07:48.731735       1 config.go:192] "Starting service config controller"
I0103 04:07:48.731800       1 config.go:319] "Starting node config controller"
I0103 04:07:48.745083       1 shared_informer.go:313] Waiting for caches to sync for service config
I0103 04:07:48.745089       1 shared_informer.go:313] Waiting for caches to sync for node config
I0103 04:07:48.731729       1 config.go:101] "Starting endpoint slice config controller"
I0103 04:07:48.745144       1 shared_informer.go:313] Waiting for caches to sync for endpoint slice config
I0103 04:07:48.845260       1 shared_informer.go:320] Caches are synced for endpoint slice config
I0103 04:07:48.845285       1 shared_informer.go:320] Caches are synced for node config
I0103 04:07:48.845266       1 shared_informer.go:320] Caches are synced for service config
I0103 04:14:59.284583       1 server.go:874] "Golang settings" GOGC="" GOMAXPROCS="" GOTRACEBACK=""
I0103 04:14:59.289578       1 config.go:101] "Starting endpoint slice config controller"
I0103 04:14:59.291489       1 shared_informer.go:313] Waiting for caches to sync for endpoint slice config
I0103 04:14:59.291552       1 config.go:319] "Starting node config controller"
I0103 04:14:59.291545       1 config.go:192] "Starting service config controller"
I0103 04:14:59.291563       1 shared_informer.go:313] Waiting for caches to sync for node config
I0103 04:14:59.291572       1 shared_informer.go:313] Waiting for caches to sync for service config
I0103 04:14:59.392300       1 shared_informer.go:320] Caches are synced for endpoint slice config
I0103 04:14:59.392386       1 shared_informer.go:320] Caches are synced for service config
I0103 04:14:59.392400       1 shared_informer.go:320] Caches are synced for node config
I0103 04:12:21.218742       1 server.go:874] "Golang settings" GOGC="" GOMAXPROCS="" GOTRACEBACK=""
I0103 04:12:21.223049       1 config.go:192] "Starting service config controller"
I0103 04:12:21.223146       1 config.go:101] "Starting endpoint slice config controller"
I0103 04:12:21.224017       1 shared_informer.go:313] Waiting for caches to sync for endpoint slice config
I0103 04:12:21.224154       1 config.go:319] "Starting node config controller"
I0103 04:12:21.224340       1 shared_informer.go:313] Waiting for caches to sync for node config
I0103 04:12:21.224017       1 shared_informer.go:313] Waiting for caches to sync for service config
I0103 04:12:21.324198       1 shared_informer.go:320] Caches are synced for endpoint slice config
I0103 04:12:21.324718       1 shared_informer.go:320] Caches are synced for node config
I0103 04:12:21.325821       1 shared_informer.go:320] Caches are synced for service config
To verify that kube-proxy is functioning correctly, we will create a temporary “Network Debugging” pod. This pod will allow us to test DNS resolution and service connectivity from within a cluster container.
Step 1: Launch a Test Pod
We’ll use the fortio or dnsutils image, as they come preloaded with networking tools such as curl, nslookup, and nc.
# Start a temporary pod and jump into a shell
kubectl run network-test --image=busybox -i --tty --rm
Test DNS Resolution: This confirms that CoreDNS is working and kube-proxy entries exist.
kubectl exec network-test -- nslookup kubernetes.default.svc.cluster.local
Server:		10.96.0.10
Address:	10.96.0.10:53


Name:	kubernetes.default.svc.cluster.local
Address: 10.96.0.1
Inspecting kube-proxy Metrics
If you want to see how fast kube-proxy is syncing rules, you can query its internal metrics endpoint. Most clusters have this enabled on port 10249.
Check sync performance via your remote proxy:
"curl -s http://localhost:10249/metrics | grep kubeproxy_sync_proxy_rules_duration_seconds"
# HELP kubeproxy_sync_proxy_rules_duration_seconds [ALPHA] SyncProxyRules latency in seconds
# TYPE kubeproxy_sync_proxy_rules_duration_seconds histogram
kubeproxy_sync_proxy_rules_duration_seconds_bucket{le="0.001"} 0
kubeproxy_sync_proxy_rules_duration_seconds_bucket{le="0.002"} 0
kubeproxy_sync_proxy_rules_duration_seconds_bucket{le="0.004"} 0
kubeproxy_sync_proxy_rules_duration_seconds_bucket{le="0.008"} 0
kubeproxy_sync_proxy_rules_duration_seconds_bucket{le="0.016"} 2
kubeproxy_sync_proxy_rules_duration_seconds_bucket{le="0.032"} 25
kubeproxy_sync_proxy_rules_duration_seconds_bucket{le="0.064"} 31
kubeproxy_sync_proxy_rules_duration_seconds_bucket{le="0.128"} 32
kubeproxy_sync_proxy_rules_duration_seconds_bucket{le="0.256"} 33
kubeproxy_sync_proxy_rules_duration_seconds_bucket{le="0.512"} 33
kubeproxy_sync_proxy_rules_duration_seconds_bucket{le="1.024"} 33
kubeproxy_sync_proxy_rules_duration_seconds_bucket{le="2.048"} 33
kubeproxy_sync_proxy_rules_duration_seconds_bucket{le="4.096"} 33
kubeproxy_sync_proxy_rules_duration_seconds_bucket{le="8.192"} 33
kubeproxy_sync_proxy_rules_duration_seconds_bucket{le="16.384"} 33
kubeproxy_sync_proxy_rules_duration_seconds_bucket{le="+Inf"} 33
kubeproxy_sync_proxy_rules_duration_seconds_sum 1.089470682
kubeproxy_sync_proxy_rules_duration_seconds_count 33
kubeproxy_sync_proxy_rules_duration_seconds: If this number is very high (seconds instead of milliseconds), your node is struggling to update its network rules, which causes “connection timeouts” during deployments
Applications
- Deployment: standard resource for running applications in a scalable environment
- StatefulSet: is an alternative to the deployment for services such as databases
- DaemonSet: is an alternative to the Deployment that ensures that one application instance is started on each cluster node
- job: Single shot applications
- CronJob: is used for scheduled applications
Web application test
To test if you can reach your cluster applications from your Mac’s browser, we will create a NodePort service. While a ClusterIP is only reachable inside the cluster, a NodePort opens a specific port (usually 30000–32767) on your machine’s physical IP (192.168.1.11).
Create the deployment:
kubectl create deployment web-test --image=nginx
deployment.apps/web-test created
Expose it as a NodePort service
kubectl expose deployment web-test --type=NodePort --port=80
service/web-test exposed
Find the Assigned Port
Kubernetes will pick a random port in the 30000+ range. You need to find out which one it chose.
Look for the PORT(S) column. It will look like 80:30495/TCP. In this example, 30495 is the port you need.
kubectl get service web-test
NAME       TYPE       CLUSTER-IP     EXTERNAL-IP   PORT(S)        AGE
web-test   NodePort   10.98.33.144   <none>        80:30495/TCP   48s
Now you can access the nginx server using the http://192.168.1.11:30495/ url.
Once you’ve verified you can see the “Welcome to nginx” page, you can delete the test resources:
# delete the service
kubectl delete service web-test
service "web-test" deleted
# delete the deployment
kubectl delete deployment web-test
deployment.apps "web-test" deleted
YAML manifest for a more complex application
To show how multiple components interact within your cluster, we will create a Guestbook-style setup: a Redis database (backend) and an Nginx web server (frontend).
This will demonstrate Service Discovery, as the frontend will find the backend using only the Service name.
Step 1: Create the Backend (Redis)
We will create a Deployment for Redis and a ClusterIP service. Because this is an internal database, we do not want to expose it to the outside world.
# Create the Redis Deployment
kubectl create deployment redis-db --image=redis
deployment.apps/redis-db created
# Expose it internally
kubectl expose deployment redis-db --port=6379 --target-port=6379
service/redis-db exposed
Step 2: Create the Frontend (Nginx)
Next, we create the web server. We will use a custom configuration (via a one-liner here) to prove it can “see” the Redis service.
# Create the Frontend Deployment
kubectl create deployment web-frontend --image=nginx
deployment.apps/web-frontend created
Here the specification of the above deployment:
kubectl get deploy web-frontend -o yaml
apiVersion: apps/v1
kind: Deployment
metadata:
  annotations:
    deployment.kubernetes.io/revision: "1"
  creationTimestamp: "2026-01-03T10:27:32Z"
  generation: 2
  labels:
    app: web-frontend
  name: web-frontend
  namespace: default
  resourceVersion: "296943"
  uid: 882765a3-0a17-4008-bf65-866c20f2f52f
spec:
  progressDeadlineSeconds: 600
  replicas: 3
  revisionHistoryLimit: 10
  selector:
    matchLabels:
      app: web-frontend
  strategy:
    rollingUpdate:
      maxSurge: 25%
      maxUnavailable: 25%
    type: RollingUpdate
  template:
    metadata:
      creationTimestamp: null
      labels:
        app: web-frontend
    spec:
      containers:
      - image: nginx
        imagePullPolicy: Always
        name: nginx
        resources: {}
        terminationMessagePath: /dev/termination-log
        terminationMessagePolicy: File
      dnsPolicy: ClusterFirst
      restartPolicy: Always
      schedulerName: default-scheduler
      securityContext: {}
      terminationGracePeriodSeconds: 30
status:
  availableReplicas: 3
  conditions:
  - lastTransitionTime: "2026-01-03T10:27:32Z"
    lastUpdateTime: "2026-01-03T10:27:35Z"
    message: ReplicaSet "web-frontend-5f4cd56f87" has successfully progressed.
    reason: NewReplicaSetAvailable
    status: "True"
    type: Progressing
  - lastTransitionTime: "2026-01-07T03:20:42Z"
    lastUpdateTime: "2026-01-07T03:20:42Z"
    message: Deployment has minimum availability.
    reason: MinimumReplicasAvailable
    status: "True"
    type: Available
  observedGeneration: 2
  readyReplicas: 3
  replicas: 3
  updatedReplicas: 3
# Expose it via NodePort so you can see it in your browser
kubectl expose deployment web-frontend --type=NodePort --port=80
service/web-frontend exposed
Step 3: Verify Internal Communication
This is the “Magic” of kube-proxy and CoreDNS. The web-frontend pod can reach the redis-db pod simply by using the name redis-db.
Run this to test the connection from frontend to backend:
# Use your proxy to run a 'redis-cli' ping from inside the nginx pod
kubectl exec deployments/web-frontend -- apt-get update -y
Get:1 http://deb.debian.org/debian trixie InRelease [140 kB]
Get:2 http://deb.debian.org/debian trixie-updates InRelease [47.3 kB]
Get:3 http://deb.debian.org/debian-security trixie-security InRelease [43.4 kB]
Get:4 http://deb.debian.org/debian trixie/main arm64 Packages [9607 kB]
Get:5 http://deb.debian.org/debian trixie-updates/main arm64 Packages [5404 B]
Get:6 http://deb.debian.org/debian-security trixie-security/main arm64 Packages [94.3 kB]
Fetched 9938 kB in 1s (6831 kB/s)
Reading package lists...
install redis tools
kubectl exec deployments/web-frontend -- apt-get install redis-tools -y
Reading package lists...
Building dependency tree...
Reading state information...
The following additional packages will be installed:
  adduser libatomic1 libjemalloc2 liblzf1
Suggested packages:
  liblocale-gettext-perl perl cron quota ruby-redis
The following NEW packages will be installed:
  adduser libatomic1 libjemalloc2 liblzf1 redis-tools
0 upgraded, 5 newly installed, 0 to remove and 0 not upgraded.
Need to get 1576 kB of archives.
After this operation, 8629 kB of additional disk space will be used.
Get:1 http://deb.debian.org/debian trixie/main arm64 adduser all 3.152 [191 kB]
Get:2 http://deb.debian.org/debian trixie/main arm64 libatomic1 arm64 14.2.0-19 [10.1 kB]
Get:3 http://deb.debian.org/debian trixie/main arm64 libjemalloc2 arm64 5.3.0-3 [216 kB]
Get:4 http://deb.debian.org/debian trixie/main arm64 liblzf1 arm64 3.6-4+b3 [10.1 kB]
Get:5 http://deb.debian.org/debian trixie/main arm64 redis-tools arm64 5:8.0.2-3+deb13u1 [1148 kB]
debconf: unable to initialize frontend: Dialog
debconf: (TERM is not set, so the dialog frontend is not usable.)
debconf: falling back to frontend: Readline
debconf: unable to initialize frontend: Readline
debconf: (Can't locate Term/ReadLine.pm in @INC (you may need to install the Term::ReadLine module) (@INC entries checked: /etc/perl /usr/local/lib/aarch64-linux-gnu/perl/5.40.1 /usr/local/share/perl/5.40.1 /usr/lib/aarch64-linux-gnu/perl5/5.40 /usr/share/perl5 /usr/lib/aarch64-linux-gnu/perl-base /usr/lib/aarch64-linux-gnu/perl/5.40 /usr/share/perl/5.40 /usr/local/lib/site_perl) at /usr/share/perl5/Debconf/FrontEnd/Readline.pm line 8, <STDIN> line 5.)
debconf: falling back to frontend: Teletype
debconf: unable to initialize frontend: Teletype
debconf: (This frontend requires a controlling tty.)
debconf: falling back to frontend: Noninteractive
Fetched 1576 kB in 0s (20.7 MB/s)
Selecting previously unselected package adduser.
(Reading database ... 6697 files and directories currently installed.)
Preparing to unpack .../archives/adduser_3.152_all.deb ...
Unpacking adduser (3.152) ...
Setting up adduser (3.152) ...
Selecting previously unselected package libatomic1:arm64.
(Reading database ... 6782 files and directories currently installed.)
Preparing to unpack .../libatomic1_14.2.0-19_arm64.deb ...
Unpacking libatomic1:arm64 (14.2.0-19) ...
Selecting previously unselected package libjemalloc2:arm64.
Preparing to unpack .../libjemalloc2_5.3.0-3_arm64.deb ...
Unpacking libjemalloc2:arm64 (5.3.0-3) ...
Selecting previously unselected package liblzf1:arm64.
Preparing to unpack .../liblzf1_3.6-4+b3_arm64.deb ...
Unpacking liblzf1:arm64 (3.6-4+b3) ...
Selecting previously unselected package redis-tools.
Preparing to unpack .../redis-tools_5%3a8.0.2-3+deb13u1_arm64.deb ...
Unpacking redis-tools (5:8.0.2-3+deb13u1) ...
Setting up libjemalloc2:arm64 (5.3.0-3) ...
Setting up liblzf1:arm64 (3.6-4+b3) ...
Setting up libatomic1:arm64 (14.2.0-19) ...
Setting up redis-tools (5:8.0.2-3+deb13u1) ...
Processing triggers for libc-bin (2.41-12) ...
# Now ping the service name :-)
kubectl exec deployments/web-frontend -- redis-cli -h redis-db ping
PONG
If it returns PONG, your cluster’s internal networking is working correctly!
Step 4: Map the Network Architecture
To help you visualise what we just built, here is how the traffic flows:
| Component | Service Type | Reachable From | Internal DNS |
|---|---|---|---|
| Redis | ClusterIP |
Only inside cluster | redis-db.default.svc.cluster.local |
| Nginx | NodePort |
Everywhere (via Node IP) | web-frontend.default.svc.cluster.local |
Step 5: View the Results
Find the NodePort for your frontend:
kubectl get svc web-frontend
NAME           TYPE       CLUSTER-IP      EXTERNAL-IP   PORT(S)        AGE
web-frontend   NodePort   10.102.205.31   <none>        80:31804/TCP   8m5s
Access via http://192.168.1.11:31804/ in the browser. You will see the Nginx welcome page, knowing that “under the hood,” this pod is successfully linked to your Redis database.
Summary Checklist
- DNS:
CoreDNSresolved the nameredis-db. - Routing:
kube-proxysent the traffic to the correct Redis pod. - Access:
NodePortallowed your Mac to enter the cluster.
Scaling your deployment is one of the best ways to see kube-proxy and the Service abstraction in action. When you scale up, Kubernetes creates new Pods, and kube-proxy immediately updates the network rules on your remote machine to include these new “endpoints.”
Step 5: Scale the Frontend
Run this command to increase the number of Nginx instances running pods from 1 to 3 in a ReplicaSet or deployment manually:
kubectl scale deployment web-frontend --replicas=3
deployment.apps/web-frontend scaled
To scale the number of nodes in a cluster, add the node using
kubeadm join.
Now we have deployed:
kubectl get deploy
NAME           READY   UP-TO-DATE   AVAILABLE   AGE
redis-db       1/1     1            1           4d1h
web-frontend   3/3     3            3           4d1h
- web-front in three pods
- redis-db in one pod
You can use
kubectl edit deploy web-frontendto edit the yaml and deploy again. The latest should be 2 in thekubectl get deploy web-frontendoutput.
Step 6: Observe the Load Balancer Endpoints
When you hit a Service, Kubernetes doesn’t just pick a Pod; it picks an Endpoint. You can watch the list of Pod IPs assigned to your service grow:
kubectl get endpoints web-frontend
NAME           ENDPOINTS                                      AGE
web-frontend   10.244.1.20:80,10.244.2.20:80,10.244.3.23:80   13m
Step 7: Verify the Load Balancing
To see load balancing in action without a browser, we can run a loop that repeatedly hits the Service.
# Get the NodePort again
NODEPORT=$(kubectl get svc web-frontend -o jsonpath='{.spec.ports[0].nodePort}')

# Hit the service 10 times and look at the logs of the pods
for i in {1..10}; do
   curl -s -I http://192.168.1.11:$NODEPORT | grep "Server"
done
Server: nginx/1.29.4
Server: nginx/1.29.4
Server: nginx/1.29.4
Server: nginx/1.29.4
Server: nginx/1.29.4
Server: nginx/1.29.4
Server: nginx/1.29.4
Server: nginx/1.29.4
Server: nginx/1.29.4
Server: nginx/1.29.4
How to see which Pod handled the request:
If you want to prove that different pods are answering, you can check the logs of all pods with the app=web-frontend label simultaneously:
kubectl logs -l app=web-frontend --tail=1
10.244.0.0 - - [03/Jan/2026:10:44:07 +0000] "HEAD / HTTP/1.1" 200 0 "-" "curl/8.7.1" "-"
10.244.0.0 - - [03/Jan/2026:10:44:07 +0000] "HEAD / HTTP/1.1" 200 0 "-" "curl/8.7.1" "-"
10.244.0.0 - - [03/Jan/2026:10:44:07 +0000] "HEAD / HTTP/1.1" 200 0 "-" "curl/8.7.1" "-"
High-Level View of the Traffic Flow
- Your Mac sends a request to
192.168.1.11:NODEPORT. - The Linux Kernel (via rules set by
kube-proxy) intercepts the packet. - The Load Balancer (iptables/IPVS) chooses one of the 3 Pod IPs at random (or via round-robin).
- The Packet is forwarded to the specific Pod on whichever node it lives.
Summary of Scaling Benefits
- High Availability: If one Pod crashes,
kube-proxyremoves its IP from the endpoints list instantly, so users don’t hit a “dead” link. - Seamless Updates: You can update your app version, and Kubernetes will swap Pods in the background while the Service IP stays the same.
Debug the application environment
Identify the Pod Name
Since we scaled the web-frontend to 3 replicas, we first need to pick one of the pod names.
kubectl get pods -l app=web-frontend
NAME                            READY   STATUS    RESTARTS   AGE
web-frontend-5f4cd56f87-t5srs   1/1     Running   0          32m
web-frontend-5f4cd56f87-vvbd4   1/1     Running   0          19m
web-frontend-5f4cd56f87-z2drx   1/1     Running   0          19m
You can run a single command (like hostname or ls) without entering the pod fully.
# Example: Check the hostname of the specific pod
kubectl exec web-frontend-5f4cd56f87-t5srs -- hostname
web-frontend-5f4cd56f87-t5srs
Check Environment Variables:
kubectl exec web-frontend-5f4cd56f87-t5srs -- env
PATH=/usr/local/sbin:/usr/local/bin:/usr/sbin:/usr/bin:/sbin:/bin
HOSTNAME=web-frontend-5f4cd56f87-t5srs
NGINX_VERSION=1.29.4
NJS_VERSION=0.9.4
NJS_RELEASE=1~trixie
PKG_RELEASE=1~trixie
DYNPKG_RELEASE=1~trixie
KUBERNETES_SERVICE_PORT_HTTPS=443
REDIS_DB_PORT_6379_TCP=tcp://10.97.28.65:6379
REDIS_DB_PORT_6379_TCP_PORT=6379
REDIS_DB_PORT_6379_TCP_ADDR=10.97.28.65
REDIS_DB_PORT=tcp://10.97.28.65:6379
KUBERNETES_SERVICE_HOST=10.96.0.1
KUBERNETES_PORT_443_TCP_PROTO=tcp
KUBERNETES_PORT_443_TCP_PORT=443
KUBERNETES_PORT_443_TCP_ADDR=10.96.0.1
REDIS_DB_SERVICE_HOST=10.97.28.65
KUBERNETES_PORT=tcp://10.96.0.1:443
KUBERNETES_PORT_443_TCP=tcp://10.96.0.1:443
REDIS_DB_SERVICE_PORT=6379
REDIS_DB_PORT_6379_TCP_PROTO=tcp
KUBERNETES_SERVICE_PORT=443
HOME=/root
Check Disk Space:
kubectl exec web-frontend-5f4cd56f87-t5srs -- df -h
Filesystem      Size  Used Avail Use% Mounted on
overlay         117G  6.2G  106G   6% /
tmpfs            64M     0   64M   0% /dev
/dev/mmcblk0p2  117G  6.2G  106G   6% /etc/hosts
shm              64M     0   64M   0% /dev/shm
tmpfs           7.7G   12K  7.7G   1% /run/secrets/kubernetes.io/serviceaccount
tmpfs           3.9G     0  3.9G   0% /proc/asound
tmpfs           3.9G     0  3.9G   0% /proc/scsi
tmpfs           3.9G     0  3.9G   0% /sys/firmware
If you need to explore the pod manually, you can open an interactive terminal (-it). Note that in a Jupyter Bash cell, this might feel a bit laggy, but it works for quick checks.
kubectl exec -it web-frontend-5f4cd56f87-t5srs -- /bin/bash
Because you are using containerd, you cannot easily use docker exec on the host machine anymore. Using kubectl exec is the “K8s-native” way to bridge that gap. Behind the scenes:
- Your request goes to the API Server.
- The API Server talks to the Kubelet on the remote node.
- The Kubelet tells containerd to start a process inside the container namespaces.
kubectl exec $(kubectl get pods -l app=web-frontend -o name | head -n 1) -- ls /usr/share/nginx/html
50x.html
index.html
To copy files from your local macOS environment (or your Jupyter instance) directly into a running container on your remote cluster, we use the kubectl cp command. This is incredibly useful for updating a config file, uploading a script, or adding static assets to a web server without rebuilding the entire image.
Prepare a Local File First, let’s create a simple HTML file:
'echo "<html>
  <body style=\"background-color: #f0f0f0; font-family: sans-serif;\">
    <h1>Hello from Jupyter!</h1>
    <p>This file was copied from my Mac to the remote K8s cluster.</p>
  </body>
</html>" > index.html'
POD_NAME=$(kubectl get pods -l app=web-frontend -o name | head -n 1)
echo "Targeting: $POD_NAME"
Targeting: pod/web-frontend-5f4cd56f87-t5srs
The syntax is kubectl cp <local-path> <pod-name>:<remote-path>. Note that for Nginx, the default web directory is /usr/share/nginx/html/.
kubectl cp index.html ${POD_NAME#pod}:/usr/share/nginx/html/index.html
Now, hit that specific pod’s IP or use your browser to see the update. If you visit your 192.168.1.11:<NODEPORT>, you might need to refresh a few times because only one of the three replicas has the new file (since we only copied it to one pod).
To see it instantly via the command line:
kubectl exec $POD_NAME -- cat /usr/share/nginx/html/index.html
<html>
  <body style="background-color: #f0f0f0; font-family: sans-serif;">
    <h1>Hello from Jupyter!</h1>
    <p>This file was copied from my Mac to the remote K8s cluster.</p>
  </body>
</html>
Important Considerations for kubectl cp
- Tar Dependency: For
kubectl cpto work, thetarbinary must be installed inside the container image. Most standard images (like Nginx) have it, but “distroless” or very slim images might not. - Ephemeral Nature: Remember that if this pod restarts or is deleted, the file you copied will be lost. For permanent changes, you should use ConfigMaps or update the Docker image.
- Permissions: You must have write permissions to the destination folder inside the container.