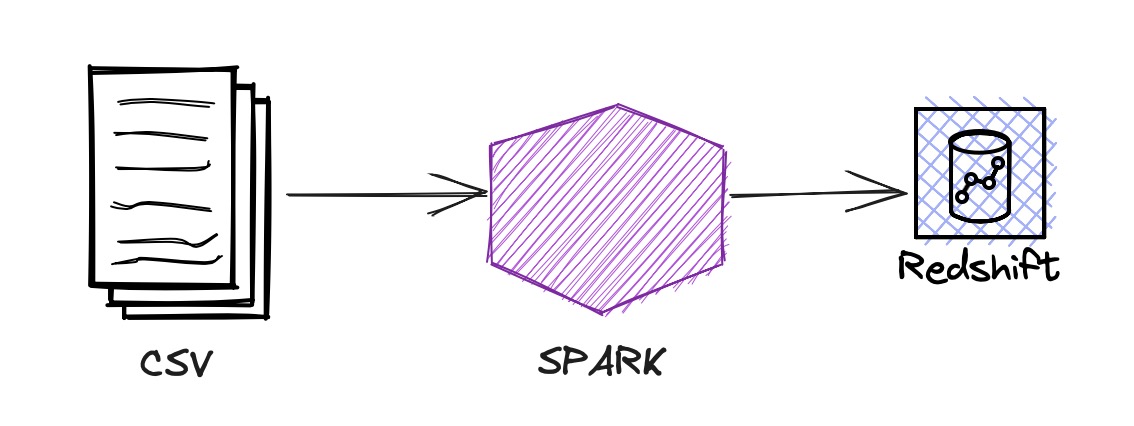
Spark to create a table in AWS Redshift
In this post, Spark reads the data from a CSV file to a DateFrame and saves that DataFrame as a Redshift table.
Introduction
This example has run in the Jupyter Notebook.
In addition to that, I’ve explained how to create a table in Postgres, use Jupyter magics and plot a diagram.
Redshift
Configure the Redshift JDBC driver and Spark Redshift JDBC driver.
%%configure -f
{
  "conf": {
    "spark.jars": "s3://<bucket>/jdbc/redshift-jdbc42-2.1.0.9.jar,s3://<bucket>/jdbc/spark-redshift.jar"
  }
}
As usual, create a Spark session.
from pyspark.sql import SparkSession

spark = SparkSession.builder \
        .appName("connectToRedshift") \
        .enableHiveSupport() \
        .getOrCreate()
In the AWS Console, find the Redshift database JDBC url
url = "jdbc:redshift://<redshift-database...>.<tt...>.ap-southeast-2.redshift.amazonaws.com:5439/<database>"
Please specify the database name at the end of the URL.
Create the Schema for the table.
from pyspark.sql.types import StructType, StructField, DateType, DecimalType, StringType
tbl_retail_sales = StructType([
    StructField("sales_month",DateType(),False),
    StructField("naics_code", StringType(), False),
    StructField("kind_of_business", StringType(), False),
    StructField("reason_for_null", StringType(), False),
    StructField("sales", DecimalType(8,2), False)
    ]
)
The above schema is created for the us_retail_sales.csv1 file to read.
df = spark.read.option("header", True).schema(tbl_retail_sales).csv("test1.csv")
# verify the schema
df.printSchema()
The most crucial step this post highlights is creating a table in the <database> specified above.
df.write \
    .format("io.github.spark_redshift_community.spark.redshift") \
    .option("url", url) \
    .option("user","<redshift user name>") \
    .option("password","<reshift password>") \
    .option("forward_spark_s3_credentials", "true") \
    .option("tempdir", "s3://<bucke>/temp") \
    .option("dbtable", "public.retail_sales") \
    .mode('append').save()
Above table will be created as
To read the Redshift table
# Read data from a table
df_tbl = spark.read \
    .format("io.github.spark_redshift_community.spark.redshift") \
    .option("url", url) \
    .option("user","<redshift user name>") \
    .option("password","<reshift password>") \
    .option("forward_spark_s3_credentials", "true") \
    .option("tempdir", "s3://<bucke>/temp") \
    .option("query", "SELECT * FROM public.retail_sales") \
    .load()
You can verify with
df_tbl.show(5)
Postgres
Create the Postgress Docker container first. Here the docker-compose.yml
version: '3.3'
services:
  postgres_db:
    container_name: postgres
    build: .
    volumes:
      - /home/ojitha/workspace/postgres/data:/var/lib/postgresql/data
    privileged: true
    # network_mode: host
    ports:
      - 5432:5432
    environment:
      POSTGRES_PASSWORD: "ojitha"
      POSTGRES_USER: "postgres"
      POSTGRES_DB: "dvdrental"
networks:
  default:
    external:
      name: ojnw-1
and Dockerfile:
FROM postgres:13.4
In my Spark Streaming Basics2 post, I’ve already explained how to create a Docker AWS Glue container to host Juputer notebooks and how to create a shared network ojnw-1.
Here is the code to insert data into Postgres:
from pyspark.sql import SparkSession

spark = SparkSession.builder \
        .appName("connectToPostgres") \
        .enableHiveSupport() \
        .config("spark.jars", "/home/glue_user/workspace/jupyter_workspace/libs/postgresql-42.6.0.jar") \
        .getOrCreate()

from pyspark.sql.types import StructType, StructField, DateType, DecimalType, StringType
tbl_retail_sales = StructType([
    StructField("sales_month",DateType(),False),
    StructField("naics_code", StringType(), False),
    StructField("kind_of_business", StringType(), False),
    StructField("reason_for_null", StringType(), False),
    StructField("sales", DecimalType(8,2), False)
    ]
)

df = spark.read.option("header", True).schema(tbl_retail_sales).csv("retail_sales.csv")

df.write.format("jdbc") \
    .option("url", "jdbc:postgresql://postgres_db:5432/sales") \
    .option("dbtable", "public.retail_sales") \
    .option("user", "postgres") \
    .option("password", "ojitha") \
    .option("driver", "org.postgresql.Driver") \
    .mode('append').save()

spark.stop()
You have to download the Postgres JDBC driver3 and configure it, as shown in line #6.
Querying
Using Jupyter Notebooks, you can query the database:
%%sql postgresql+pg8000://postgres:ojitha@postgres_db:5432/sales
select * from retail_sales limit 10;
Here postgres_db is the Docker service name.
In the next cell, run the SQL query and get the sql.run.ResultSet result:
%%sql result <<
SELECT date_part('year',sales_month) as sales_year
,sum(case when kind_of_business = 'Women''s clothing stores'
          then sales
          end) as womens_sales
,sum(case when kind_of_business = 'Men''s clothing stores'
          then sales
          end) as mens_sales
FROM retail_sales
WHERE kind_of_business in ('Men''s clothing stores'
 ,'Women''s clothing stores')
GROUP BY 1
order by 1
;
Convert above query4 result to Pandas Dataframe:
df = result.DataFrame()
Convert object types to integer or numeric types:
df["sales_year"] = df["sales_year"].astype('int')
df["womens_sales"] = df["womens_sales"].astype('int')
df["mens_sales"] = df["mens_sales"].astype('int')
df.set_index('sales_year', inplace=True)

df.info()
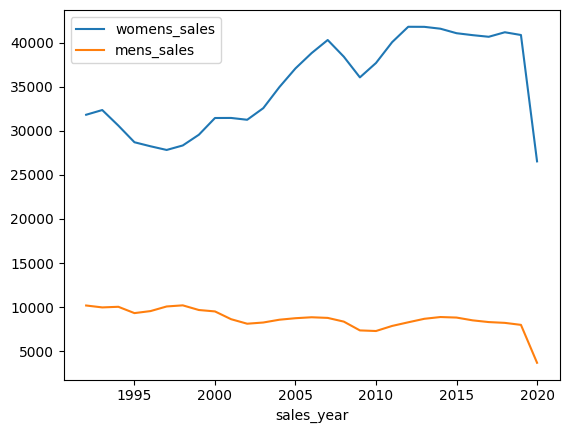
Graph
You can plot the graph from the data frame:
%matplotlib inline
import matplotlib.pyplot as plt
df.plot(kind='line', y=['womens_sales','mens_sales'], subplots=False)
You can use Jupyter matplotlib magic to plot the following diagram.
References:
-
SQL for Data Analysis, Cathy Tanimura ↩